


Interactive Access
Insights is State Street Markets’ interactive research platform designed for institutional investors. Available as a web-based interface and a companion mobile app, Insights hosts a curated mix of strategist views, academic research, and proprietary indicators. The platform includes five core sections—Home, Research, Indicators, Markets, and Signal Studio—each built to help you explore, analyze, and apply our research.
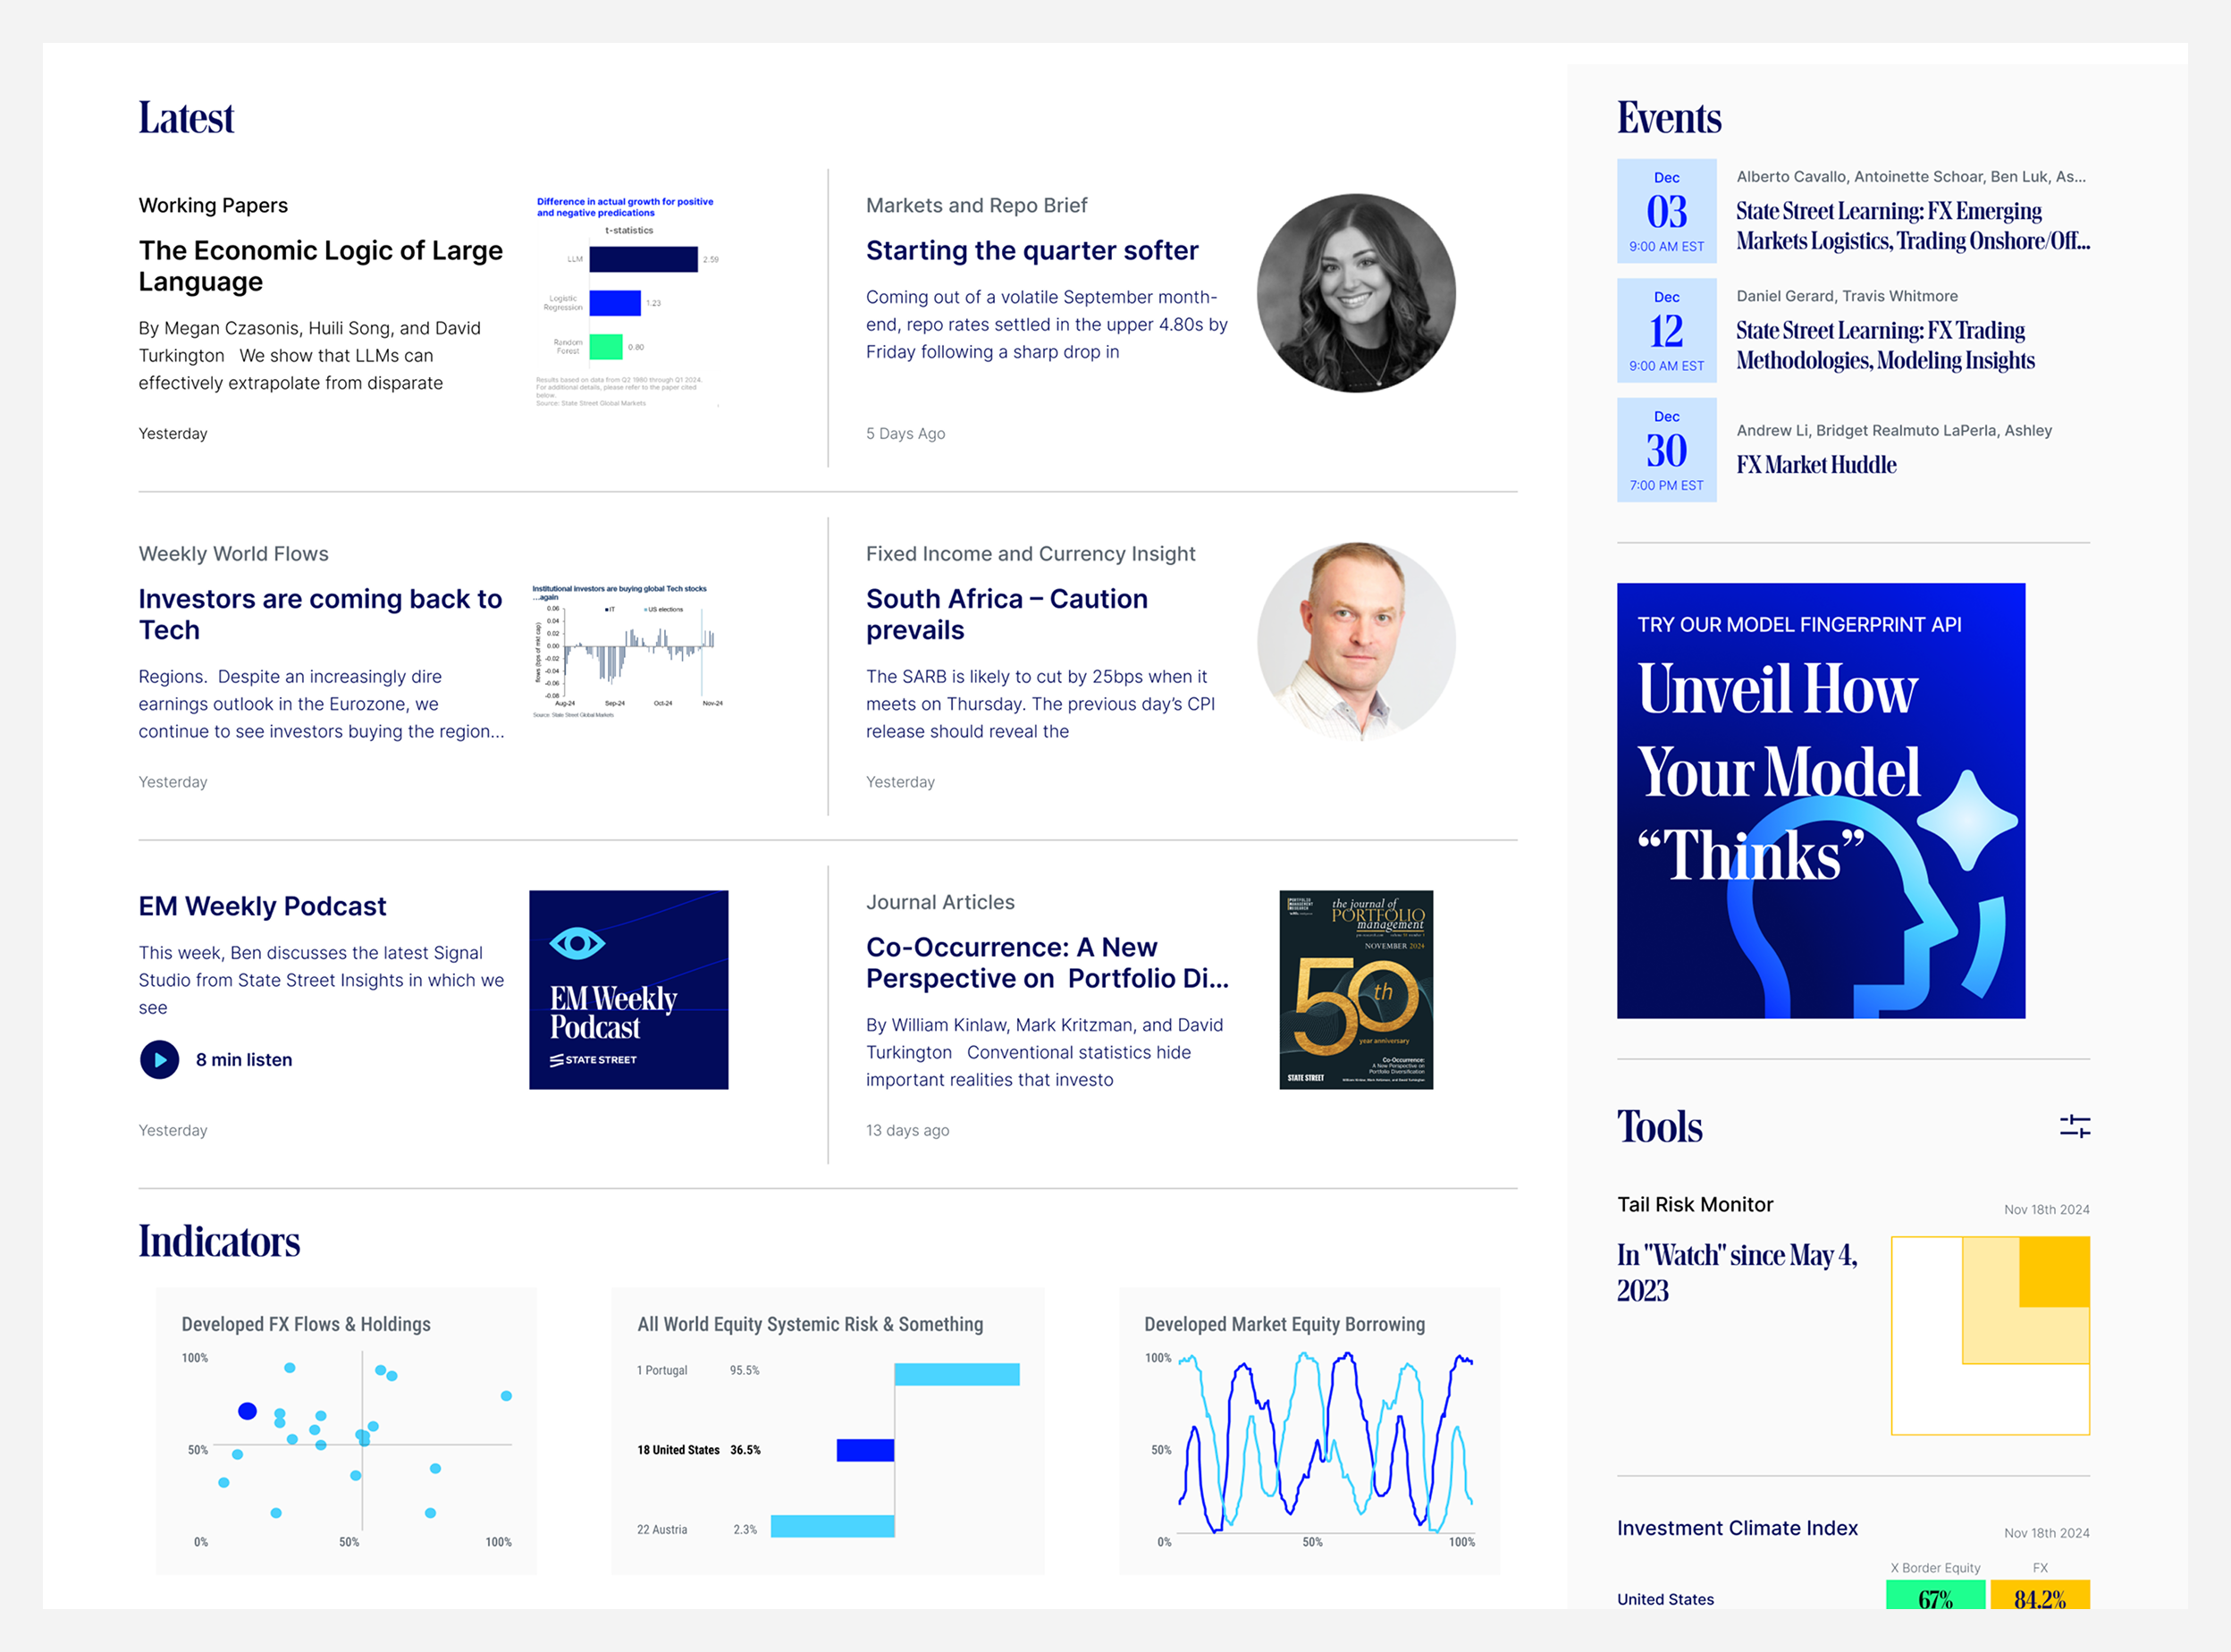
Home
The Home section gives you a real-time snapshot of market conditions, featuring strategist views, academic research, and proprietary indicators organized by theme and region. Interactive widgets highlight key signals of investor behavior, inflation, and central bank sentiment. Filters at the top let you jump directly into focused research pages for asset classes like FX or regions like Emerging Markets. It’s built to reflect your preferred focus, making it easy to stay current and dive deeper as new needs and opportunities arise.
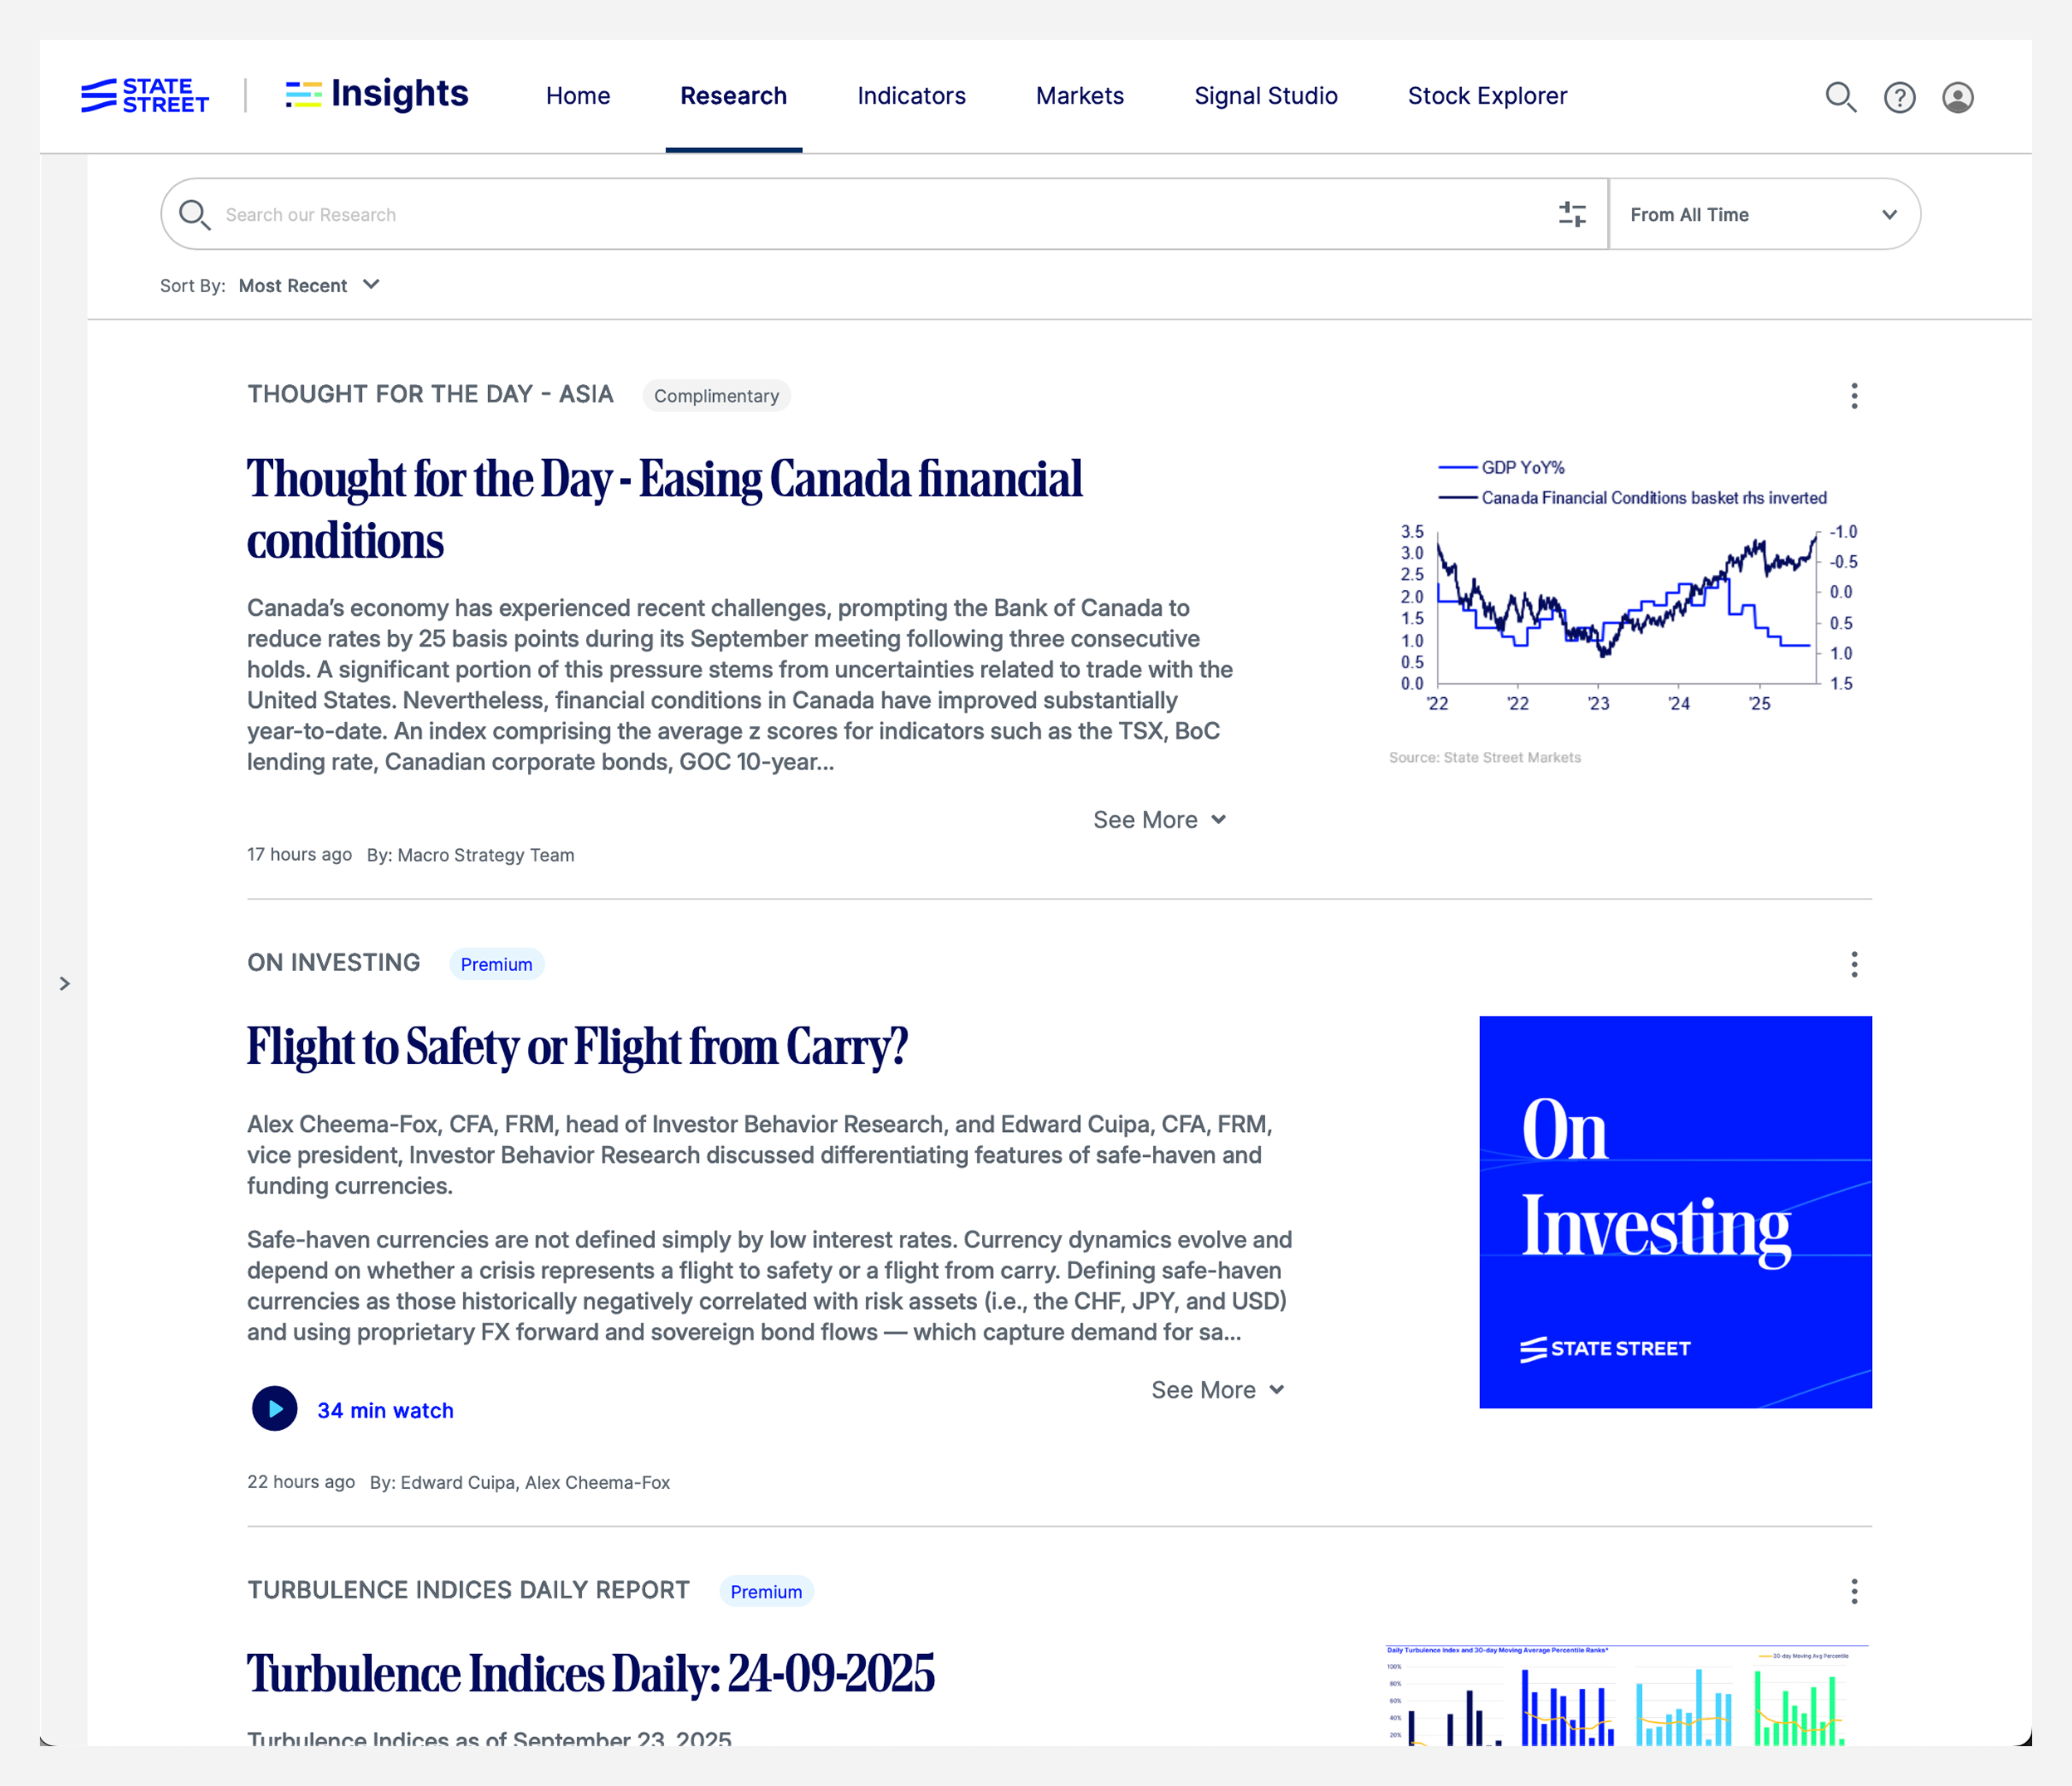
Research
Explore the Research section to follow our thinking across macro strategy and academic collaboration. You can search by author, theme, asset class, or publication type to build a focused view of insights from our experts, academic papers, and thematic research. Strategist views appear as both articles and podcasts, and subscriptions let you stay connected to the publications you rely on. Our research is designed to support many different investment styles and topics, so it can adapt to the areas that matter most to you.
Indicators
Use the Indicators section to explore proprietary signals built from robust measures of investor behavior, inflation data, media sentiment, and macro risk. You can chart trends across asset classes, compare positioning and flows, and track how sentiment shifts over time. Choose from a wide range of indicators and view them as time series, scatter plots, or tornado charts. Each indicator includes context and methodology so you know exactly what you're looking at. It’s a fast way to turn data into insight.
Learn more about our indicators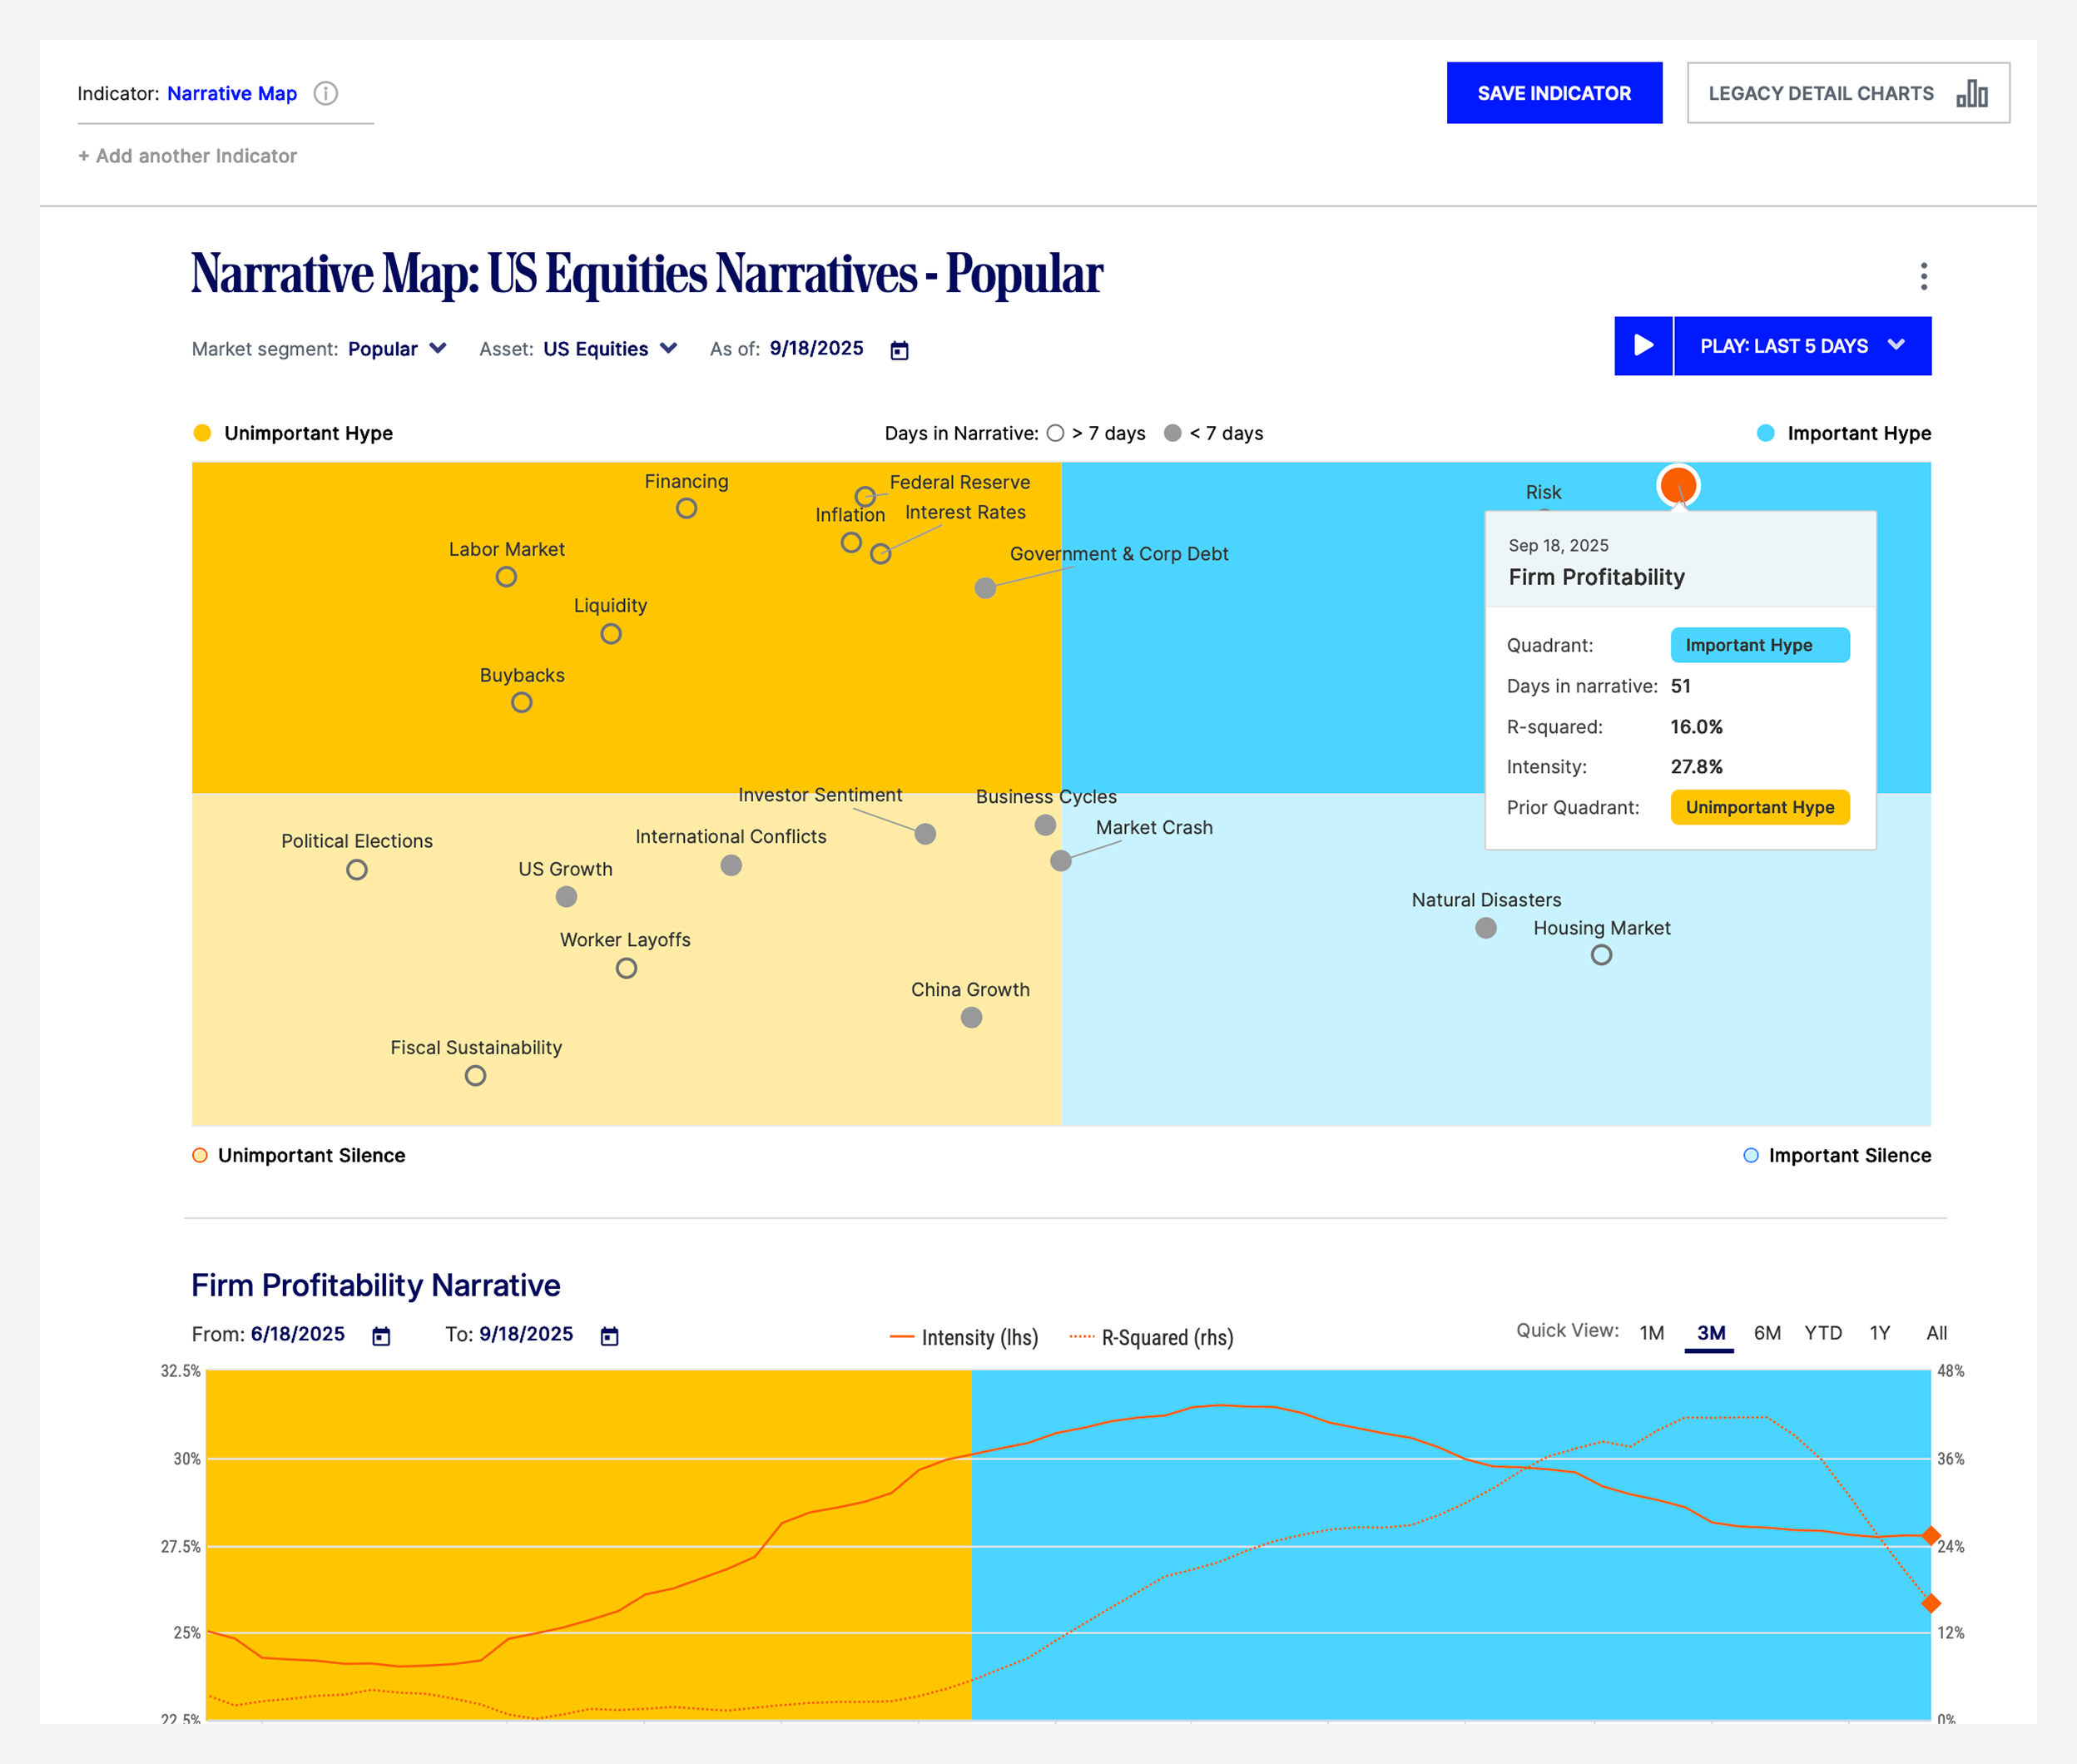
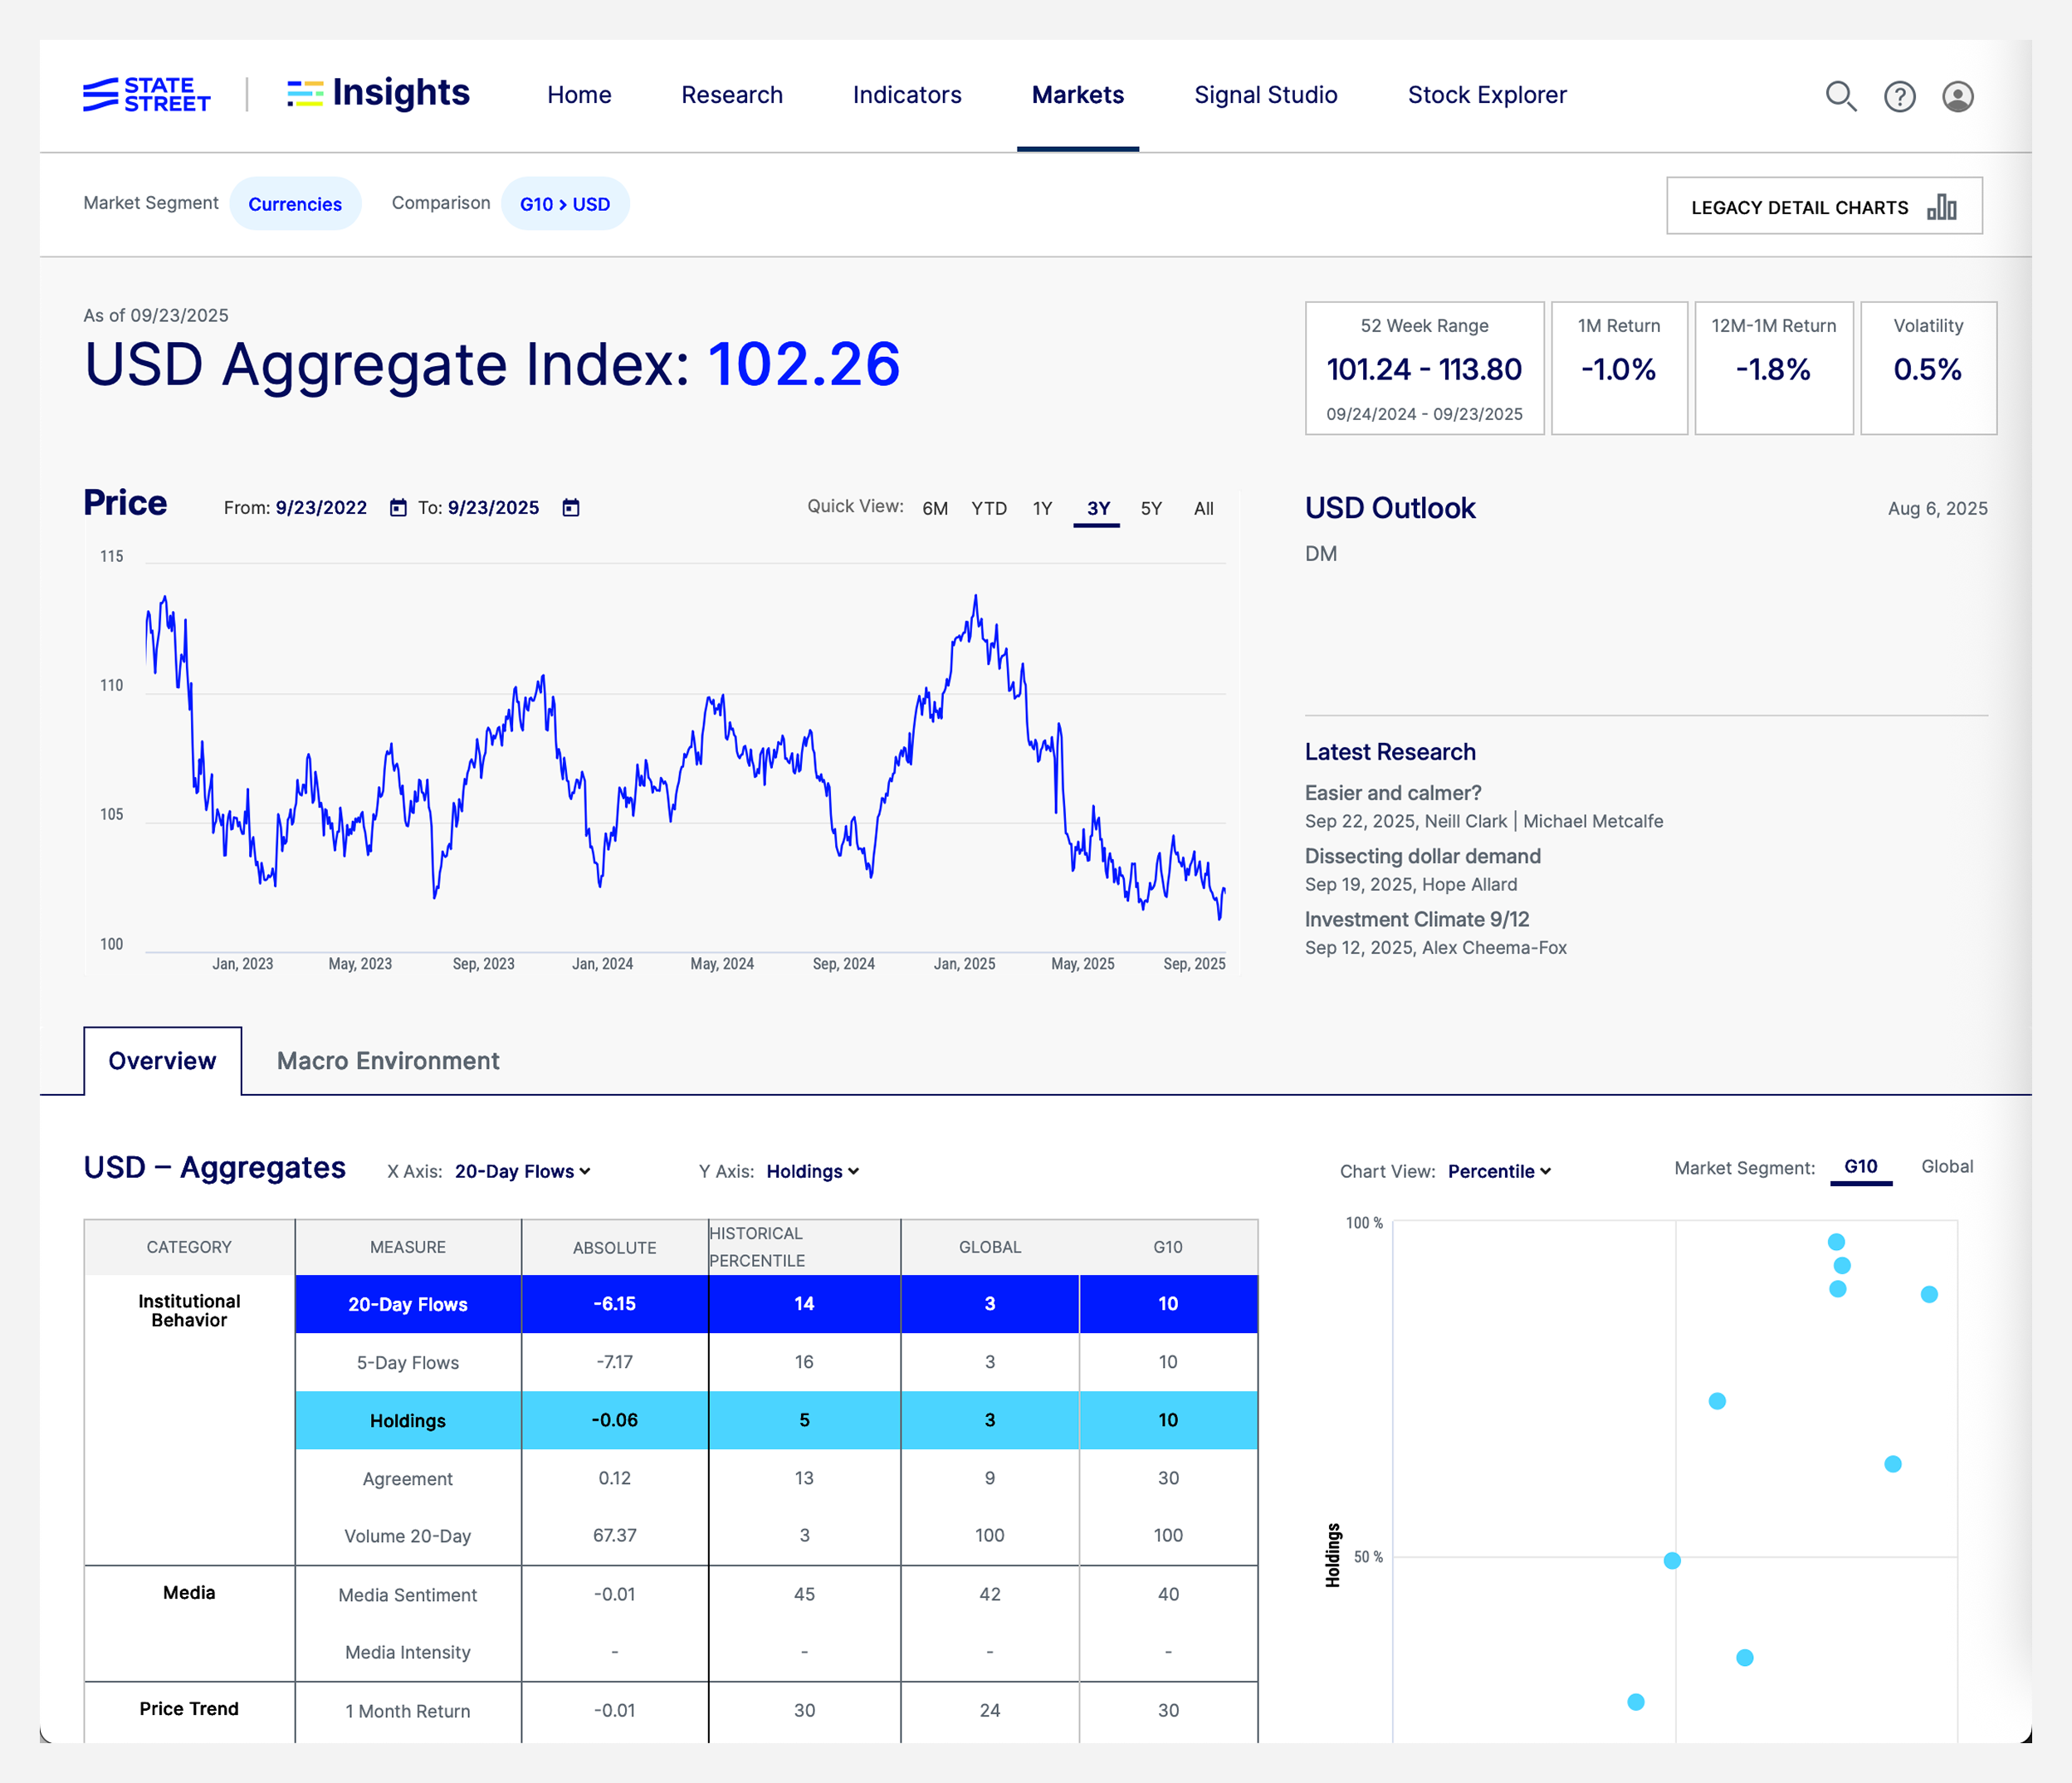
Markets
The Markets section gives you a focused view of global currency dynamics. You can explore how our indicators capture sentiment, inflation, and central bank tone across the globe. Each page helps you assess the macro backdrop behind directional signals. It’s built to help you move from signal to strategy with clarity.
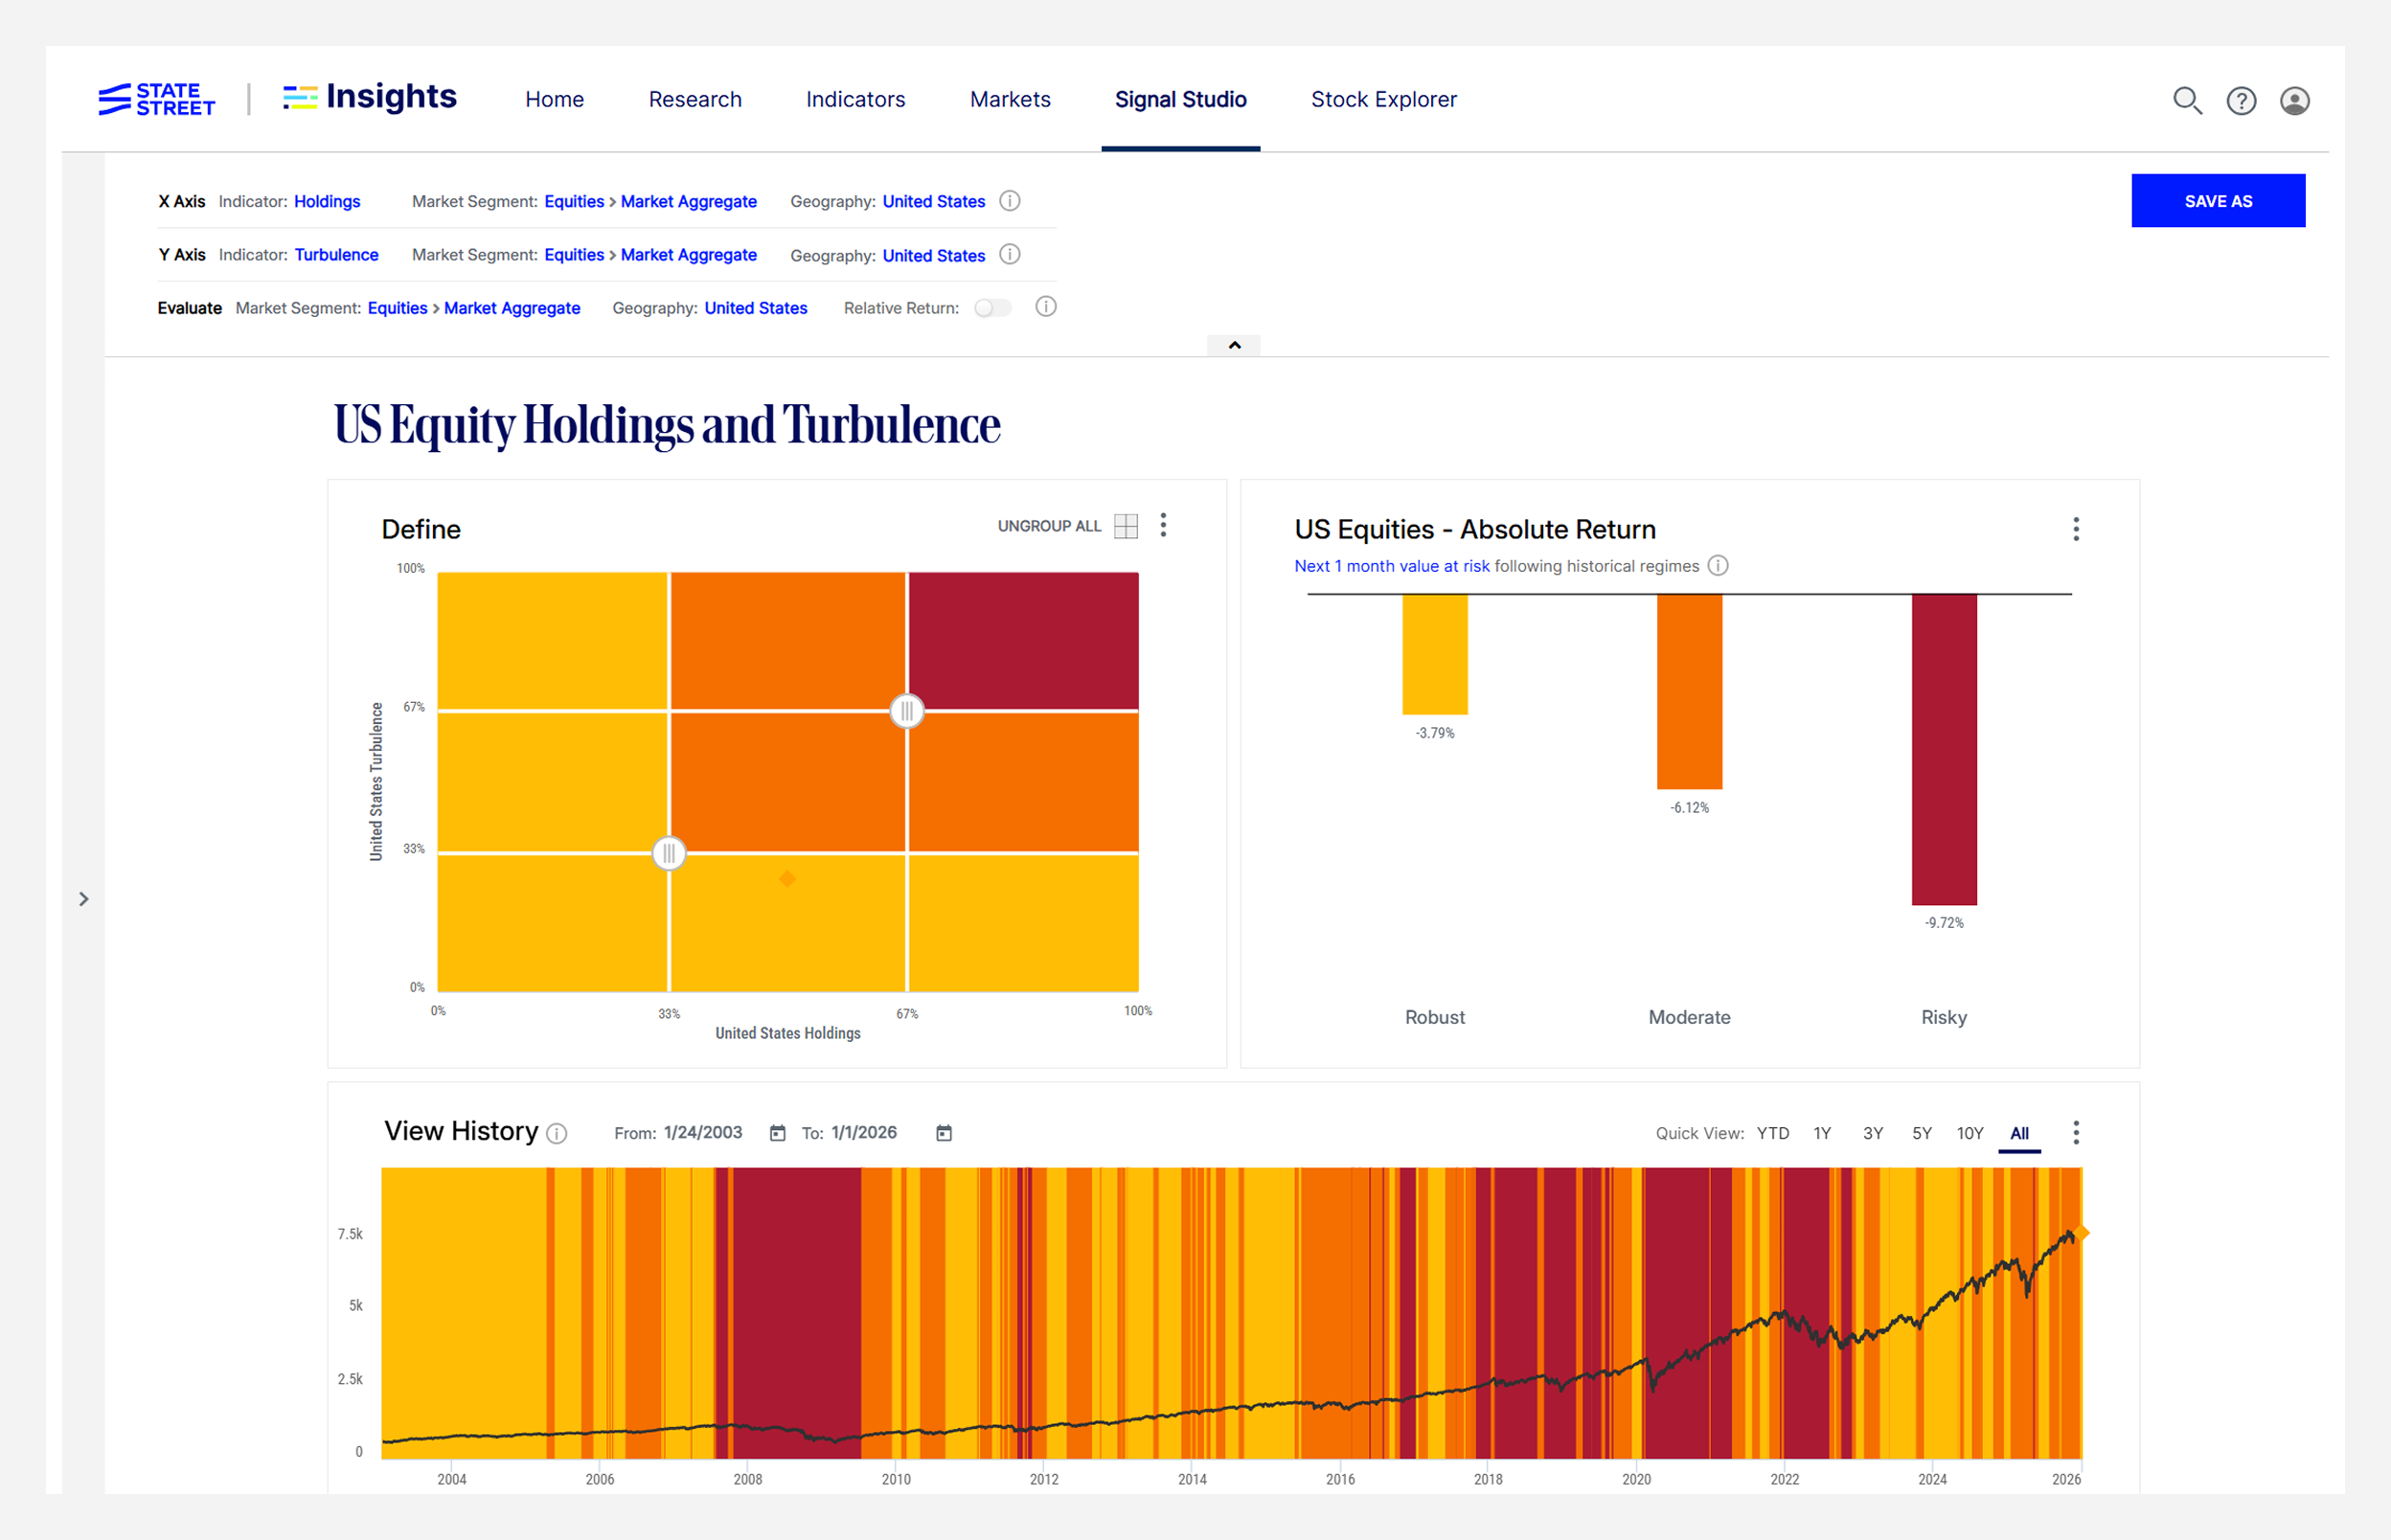
Signals
Signal Studio offers instant analytics to translate indicator signals into historical context for asset performance. Build a scenario using your chosen indicators, and the tool will show how assets behaved when those conditions occurred. You’ll see metrics like annualized return, volatility, and hit rate—giving you a clearer sense of what to expect. Signal Studio empowers you to test creative ideas on-demand to support better-informed decisions.
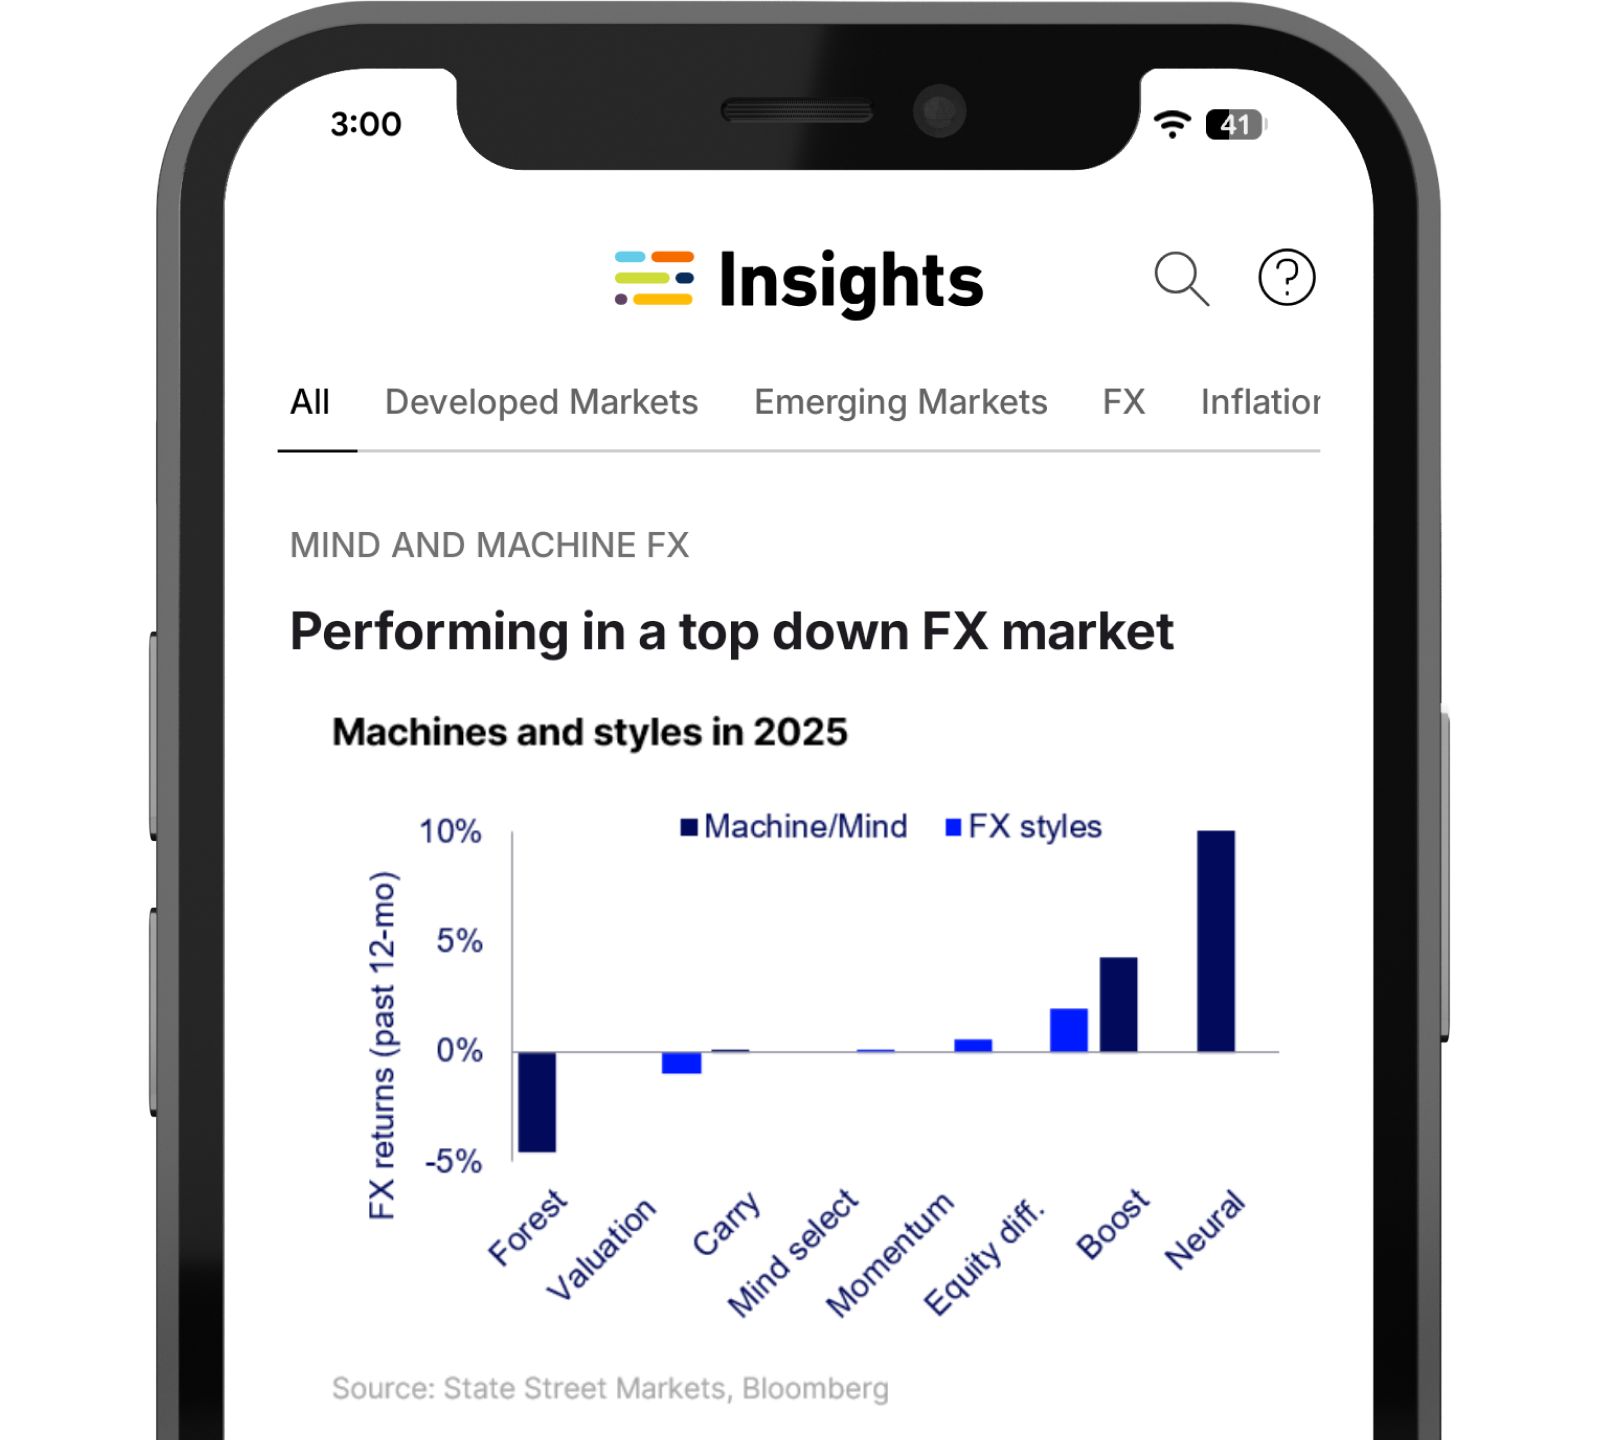
Mobile App
Take Insights with you using our iOS mobile app. You’ll get full access to strategist articles and podcasts, proprietary indicators, and your saved subscriptions—synced directly from your desktop preferences. The app is built for quick navigation and fast reads, so you can stay connected to market developments wherever you are. It’s the same research experience, optimized for mobility.
Analytical APIs
Markets move fast; your research should, too. Our vision is simple: turn discovery into deployment without the usual lag. Analytical APIs let you bring cutting edge methods into production quickly, so your teams can test, refine, and scale ideas faster while staying anchored to the science that makes them work.
Every prediction starts with a question: which past experiences best mirror today, and which details truly inform the outcome? Relevance builds forecasts as relevance‑weighted averages of past outcomes, prioritizing observations that are similar to today and informative. Task‑level fit communicates confidence, and codependence ties the choice of observations to the choice of predictors.
Use censored subsamples for conditional accuracy or full‑sample as a linear baseline; grid prediction then reliability‑weights across variable/threshold combinations for robust performance across regimes.
Use censored subsamples for conditional accuracy or full‑sample as a linear baseline; grid prediction then reliability‑weights across variable/threshold combinations for robust performance across regimes.
When stakeholders ask “why did the model say that?”, Fingerprint quantifies the answer. Using partial predictions, our method decomposes forecasts into linear, nonlinear, and interaction effects at both the model level and instance level, so you can attribute the underlying logic of predictions clearly. Because components sum back to the original prediction, you can connect the dots from data to decision with clear, defensible evidence.
Every prediction starts with a question: which past experiences best mirror today, and which details truly inform the outcome? Relevance builds forecasts as relevance‑weighted averages of past outcomes, prioritizing observations that are similar to today and informative. Task‑level fit communicates confidence, and codependence ties the choice of observations to the choice of predictors.
Use censored subsamples for conditional accuracy or full‑sample as a linear baseline; grid prediction then reliability‑weights across variable/threshold combinations for robust performance across regimes.
Read the research:
Use censored subsamples for conditional accuracy or full‑sample as a linear baseline; grid prediction then reliability‑weights across variable/threshold combinations for robust performance across regimes.
Read the research:
When stakeholders ask “why did the model say that?”, Fingerprint quantifies the answer. Using partial predictions, our method decomposes forecasts into linear, nonlinear, and interaction effects at both the model level and instance level, so you can attribute the underlying logic of predictions clearly. Because components sum back to the original prediction, you can connect the dots from data to decision with clear, defensible evidence.
Read the research:
Read the research:
1. Peter L. Bernstein Award for Best Article in an Institutional Investor Journal in 2013; Bernstein-Fabozzi/Jacobs-Levy Award for Outstanding Article in the Journal of Portfolio Management in 2006, 2009, 2011, 2013 (2), 2014, 2015, 2016, 2021; Graham & Dodd Scroll Award for article in the Financial Analysts Journal in 2002 and 2010. Roger F. Murray First Prize for Research Presented at the Q Group Conference in 2012, 2021, 2023. Harry M. Markowitz Award for Best Paper in the Journal of Investment Management in 2022, 2023. Doriot Award for Best Private Equity Research Paper in 2022.